12
BARBADOS PUBLIC WORKERS’ CO-OPERATIVE CREDIT UNION LIMITED
ANNUAL REPORT 2013
Revenues:
The Group’s total revenue from all sources grew by $2.8 million
or 3.7 percent over the prior year.
This included interest income which increased by $2.4 million
or 3.4 percent and other income which increased by $0.4
million or 10.8 percent.
The increase is attributed to the modest growth in the total
loan portfolio during the year as well as declines in the average
lending rate over the same period.
Net interest income:
Net interest income increased to $45.5 million, an increase of
$2.6 million or 6 percent, largely as a result of the fact that
total interest expense declined slightly on a year over year
basis. However, the Group’s net interest margin remained at
4.9 percent for both 2013 and 2012 financial years. This is
attributed to the narrowing of the interest spread between
the average lending rate and deposit rates which have been
declining since 2009.
Net income:
On a consolidated basis the Group recorded total consolidated
net income of $12.9 million for the year ended March 31,
2013 compared with $9.2 million for the previous year.
This represented an increase of $3.7 million or 40.2 percent
over the prior year. This increase is largely attributable to a
reduction in operating expenses of $1.7 million and growth in
net interest and other income of $2.9 million which was offset
by increased loan loss provision of $0.9 million.
Efficiency and expense management:
The Group’s strategy during the 2013 financial year was one
which focused heavily on efficiency and expense management
while at the same time adding valued member and customer
service.
Total non-interest expenses for the year under review amounted
to $31.5 million, which represented a decrease of $1.7 million
or 5.2 percent below the $33.2 million incurred during the
corresponding period last year.
Significantly contributing to the decrease were reductions in
amortization and marketing costs. Amortization of deferred
expenses decreased by $1.1 million while marketing decreased
by $119 thousand. However, personnel costs and depreciation
increased by $519 thousand and $64 thousand respectively.
Amortization of deferred expenses:
A noticeable decrease was seen in the amortization of
deferred expenses; these amounts represented research and
development expenditure which was previously amortized over
a three year period.
However, in 2012 cumulative amounts which totaled $1.3
million from previous years were written off in that year. This
expenditure is now expensed as incurred. The amounts incurred
and expensed in 2013 totaled approximately $180 thousand.
Operating leases:
During the financial year the Group secured additional
operational facilities as part of its expansion strategy which
features “Supermarket Banking”.
The newest additions feature the establishment of a “Lending
Centre” at the Emerald City location in St. Philip and a new
branch at the Carlton & A1 complex in Black Rock, St. Michael.
The Carlton & A1 branch is strategically placed to provide
convenience for members living in the North of the island.
As a consequence of these expansions the rental expenses
for the Group increased by $150 thousand over the prior year
moving from $22 thousand in 2012 to $172 thousand in 2013.
Asset management:
The Group’s consolidated asset base increased from $906.2
million in 2012 to $951.5 million at March 31, 2013 - an
increase of $45.3 million or 5.0 percent over the prior year.
During the year cash and investments increased by $18.3
million or 15.2 percent.
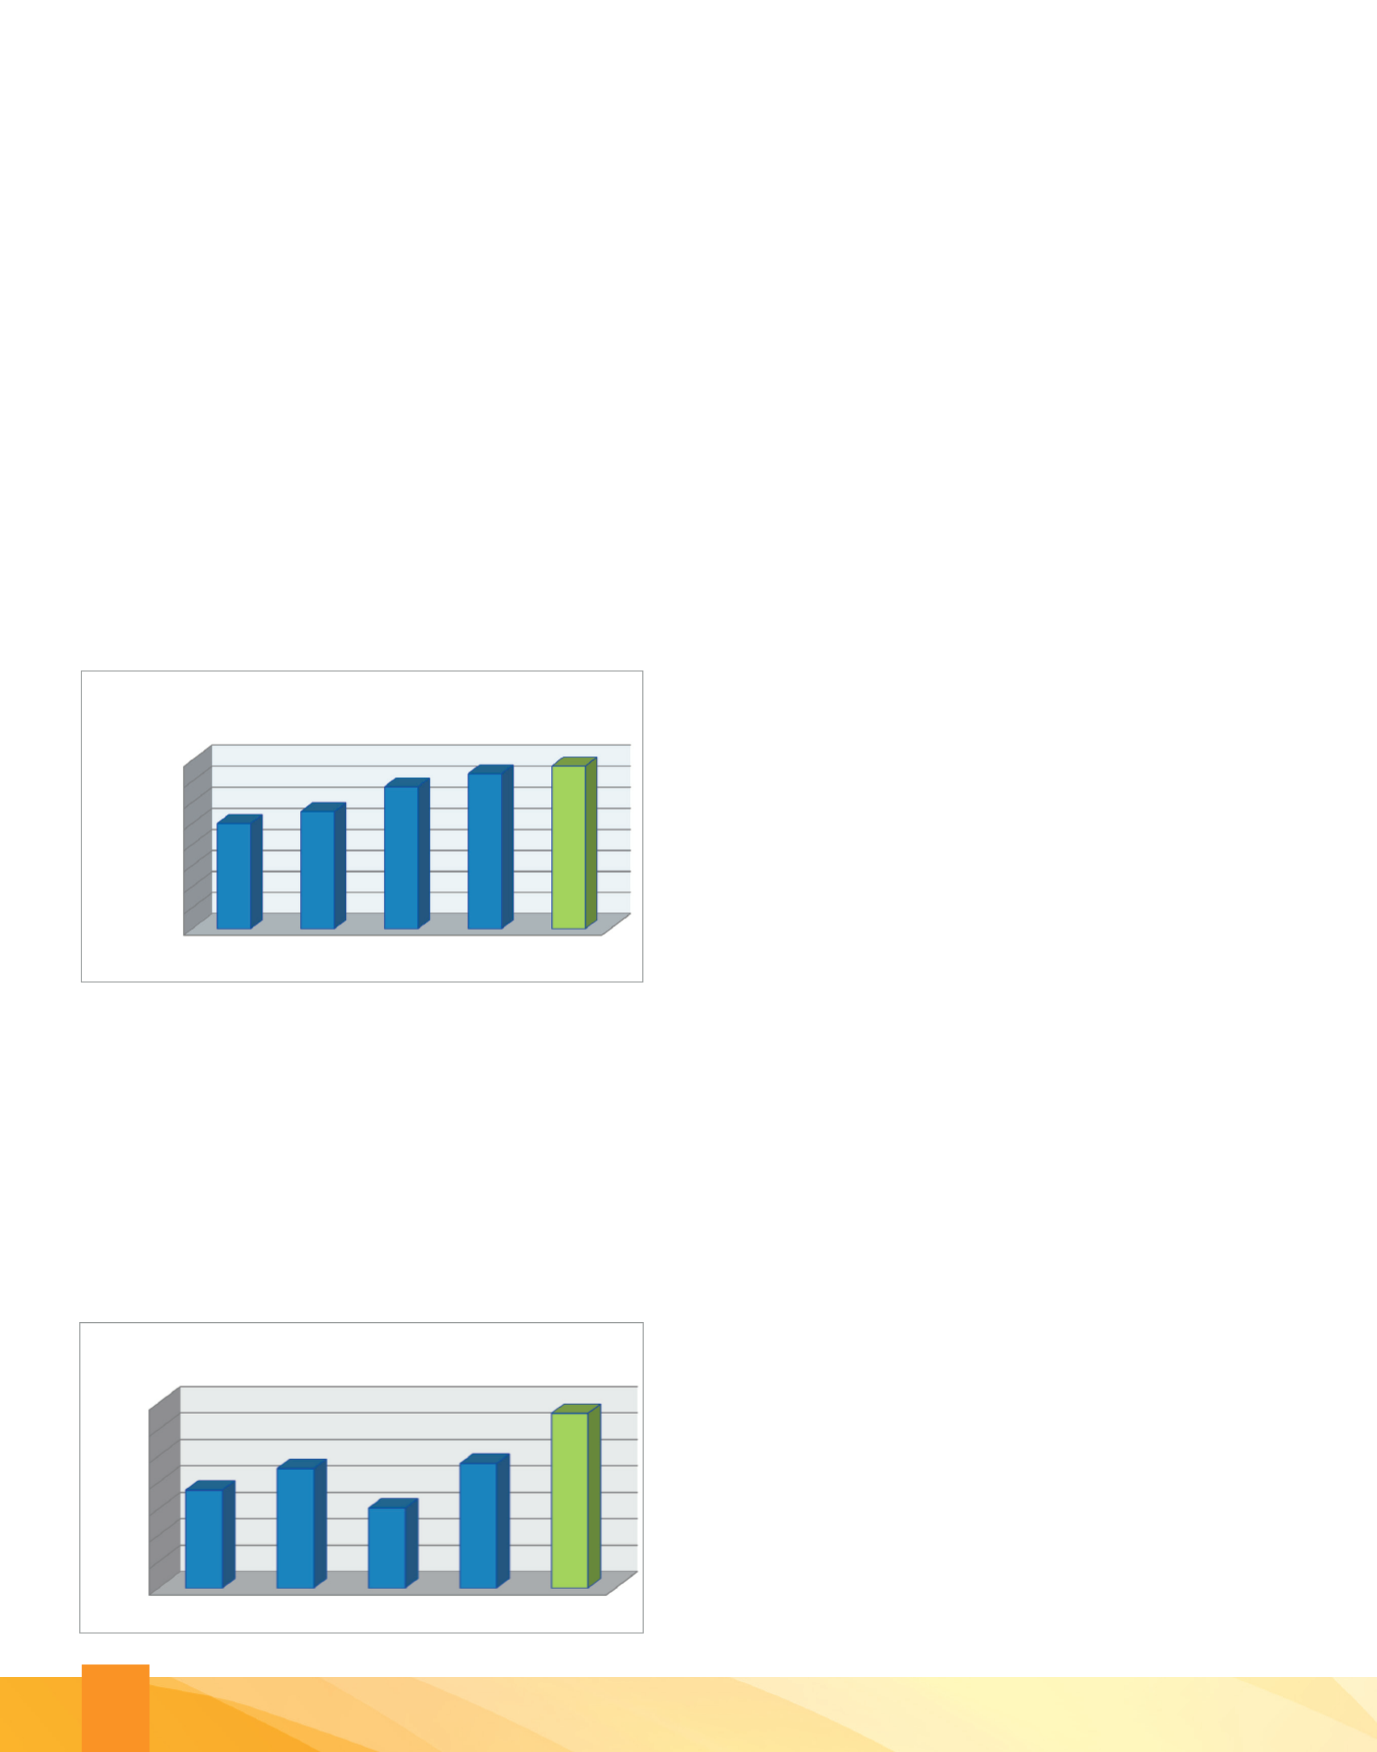
At the end of the financial year, net loans and advances rose to
$774.6 million, inclusive of cumulative impairment provision of
$20.6 million, as compared to $749.7 million and $17.5 million
respectively at the end of the previous year. Consumer loans
were the major engine of loan growth during the year.
0
100,000
200,000
300,000
400,000
500,000
600,000
700,000
800,000
2009
2010
2011
2012
2013
486,712
545,488
712,623 749,729 774,615
In BD$'000
Loans and advances
0
100,000
200,000
300,000
400,000
500,000
600,000
700,000
800,000
2009
2010
2011
2012
2013
499,745 556,123
673,773
735,909 772,320
In BD$'000
Deposits
0
200,000
400,000
600,000
800,000
1,000,000
2009
2010
2011
2012
2013
599,364 671,756
842,307 906,186 951,509
In BD$'000
Total assets
0
2,000
4,000
6,000
8,000
10,000
12,000
14,000
2009
2010
2011
2012
2013
7,415
9,044
6,052
9,424
13,214
In BD$'000
Net Income


